本篇學習筆記主要介紹如何使用R ggplot2 套件的圖層概念來進行資料視覺化 Data Visualization,使用數據則為透過R連接SQLite 資料庫而取得。R基本上可以從資料庫下載資料和上傳資料,使用的函數依據資料庫不同而有所異,但所有資料庫指令都還是基本的SQL語法。
本篇筆記重點
- 如合使用R連接SQLite資料庫
- 簡易資料處理
- 進行簡易視覺化
本篇將分為幾個步驟:
step 1 :使用R連接SQLite DB
step 2: 資料處理 using dplyr
step 3 : 簡易資料視覺化 using ggplot2
step 1: 使用R連接SQLite DB
載入所需套件
|
1 2 |
library(RSQLite) #連接SQLite DB library(dplyr) #資料處理 |
建立db連線
|
1 |
con |
列出所有DB中的table
|
1 2 |
dbListTables(con) # [1] "records" |
查看table”records”資料欄位
|
1 2 |
dbListFields(con,"records") # [1] "boardname" "popularity" "timestamp" |
輸入指令並回傳資料。並記得關閉連線。
|
1 2 3 4 5 6 7 8 |
pttRecords dbGetQuery(con,'select * from records') class(pttRecords) # [1] "data.frame" # 關閉連線 dbDisconnect(con) |
檢視資料前十列。
|
1 2 3 4 5 6 7 8 9 10 11 12 13 |
pttRecords %>% head(10) # boardname popularity timestamp # 1 Gossiping 15386 2018-05-07 22:24:30 # 2 NBA 5076 2018-05-07 22:24:30 # 3 Baseball 3759 2018-05-07 22:24:30 # 4 Stock 3204 2018-05-07 22:24:30 # 5 C_Chat 2882 2018-05-07 22:24:30 # 6 sex 2301 2018-05-07 22:24:30 # 7 LoL 2255 2018-05-07 22:24:30 # 8 movie 2209 2018-05-07 22:24:30 # 9 WomenTalk 1659 2018-05-07 22:24:30 # 10 Lifeismoney 1377 2018-05-07 22:24:30 |
SQL 基本語法:https://www.w3schools.com/sql/
step 2: 資料處理 using dplyr
先檢視時間戳distinct value
|
1 2 3 4 |
pttRecords %>% select(timestamp) %>% distinct() # timestamp # 1 2018-05-07 22:24:30 # 2 2018-05-08 21:42:39 |
篩選某一天時間戳的資料並按照各版位人氣高到低排序
|
1 2 |
tmp % filter(timestamp == '2018-05-07 22:24:30') %>% arrange(desc(popularity)) |
篩選人氣前10的版位資料
|
1 |
tmp2 % head(10) |
Step 3 : 簡易資料視覺化using ggplot2
將該時間戳top10版位人氣繪製bar圖。繪製bar chart(x: discrete, y: continuous)有兩種方法:(*如果x,y皆為 continuus,則使用geom_histogram())。
- geom_col(): stat預設值為stat_identity,即bar圖的高會使用資料的值。
- geom_bar(): stat預設值為”stat_count”,即每個x資料點對應的資料次數。如果希望bar圖的高度呈現資料值,則須將stat = “identity”。
|
1 2 3 4 5 6 7 |
library(ggplot2) a # bar chart method 1: a + geom_col() # bar chart method 2: a + geom_bar(stat = "identity") |
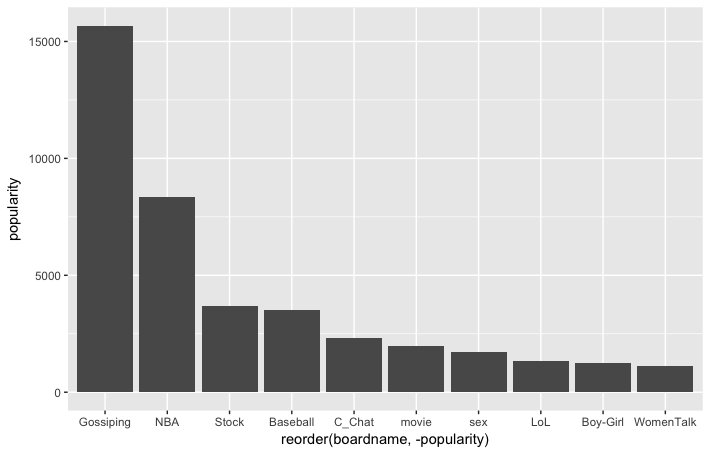
如果想要進一步將bar圖依據不同版位上色,我們可以選取自己想要的色調
|
1 2 |
# 列出所有色調模組 RColorBrewer::display.brewer.all() |
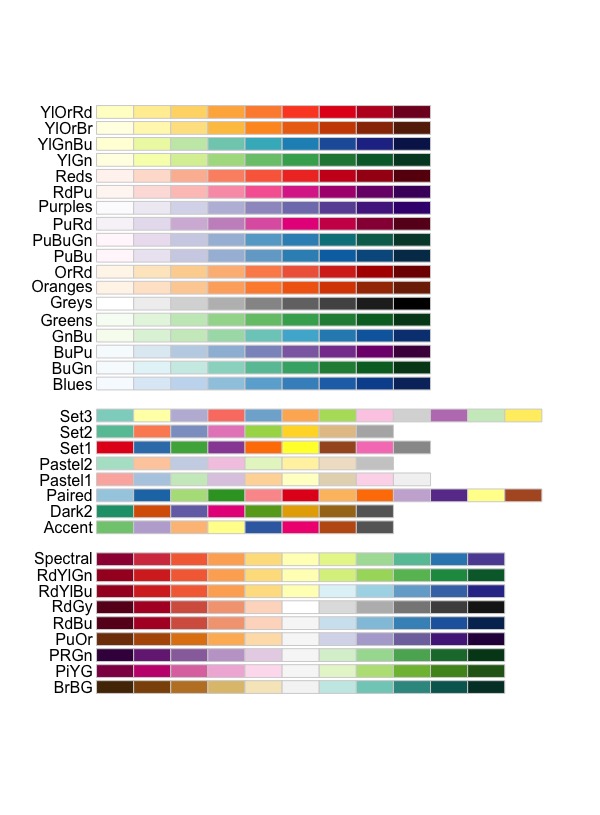
我們使用scale_fill_brewer()圖層來指定色調(我們從上圖選擇’Set3’的palette)。
|
1 2 3 |
a + geom_bar(stat = "identity",aes(fill = boardname)) + scale_fill_brewer(palette = 'Set3') |
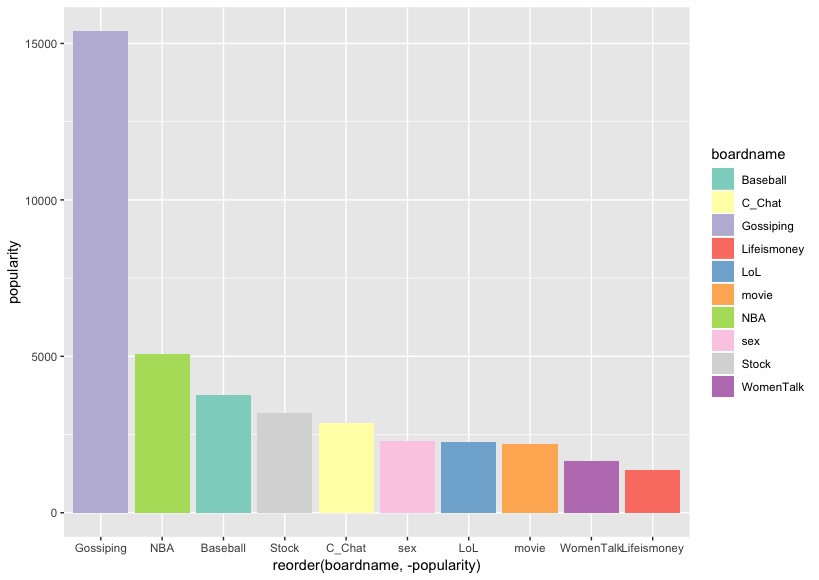
從上圖,我們發現X軸的每行資料欄位的字部分疊在一起,於是我們近一步進行以下調整:
- theme()圖層:
- axis.text.x參數:將X軸的文字做一些角度旋轉。
- text參數:指定中文字型,以解決中文亂碼問題。
- labs()圖層:
- title: 圖標題
- x: x軸標題
- y: y軸標題
|
1 2 3 4 5 6 7 8 9 |
a + geom_bar(stat = "identity",aes(fill = boardname)) + scale_fill_brewer(palette = 'Set3') + labs(title = 'PPT人氣版位Top10', x = "版位", y = "人氣") + theme(text=element_text(family="黑體-繁 中黑"), # 解決中文亂碼問題 axis.text.x = element_text(angle = 45, vjust = 0.5), plot.title = element_text(hjust = 0.5)) # 將title置中 |
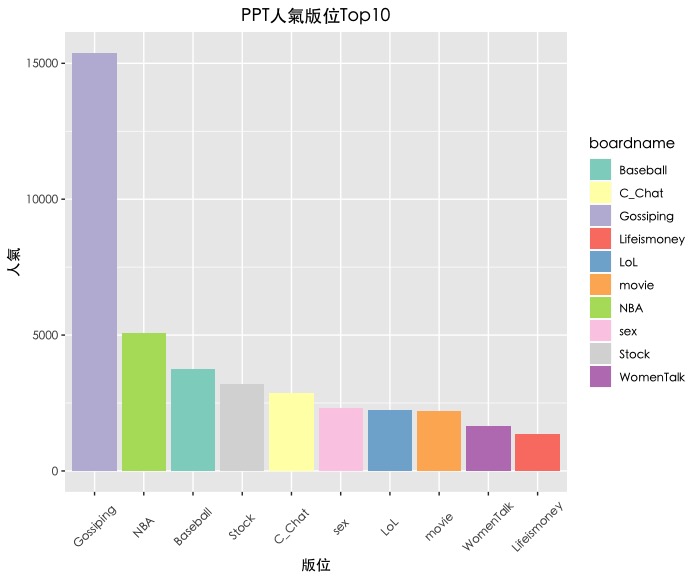
調整y軸數值單位與顯示方式。因為y軸為連續數值,因此我們使用scale_y_continuous()圖層。
|
1 2 3 4 5 6 7 8 9 10 11 12 |
a + geom_bar(stat = "identity",aes(fill = boardname)) + scale_fill_brewer(palette = 'Set3') + labs(title = 'PPT人氣版位Top10', x = "版位", y = "人氣") + theme(text=element_text(family="黑體-繁 中黑"), # 解決中文亂碼問題 axis.text.x = element_text(angle = 45, vjust = 0.5), plot.title = element_text(hjust = 0.5)) + # 將title置中 scale_y_continuous(labels = scales::unit_format("k", 1e-3), #以每千單位顯示 breaks = seq(0,20000, by=2000) #每兩千為間隔 ) |
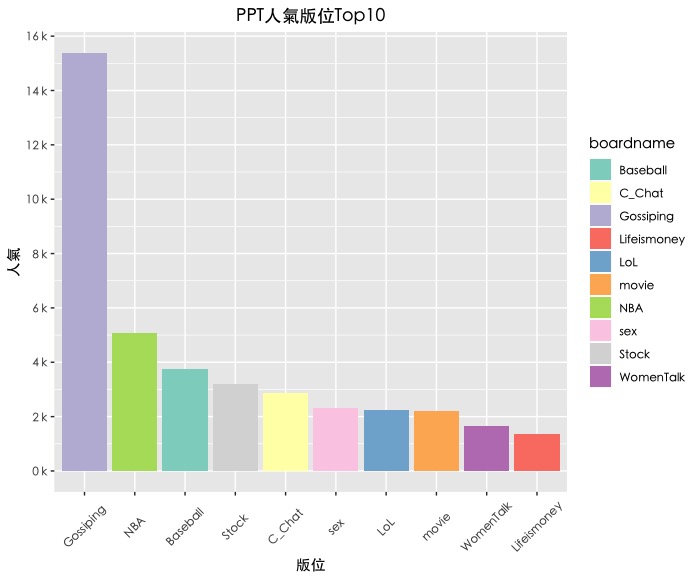
將每一條bar加上數值標籤。我們可以新增geom_text()圖層。(*這邊因為會用到str_c()函數來串連多個字串成一個新字串,我們載入套件stringr)
|
1 2 3 4 5 6 7 8 9 10 11 12 13 14 15 16 |
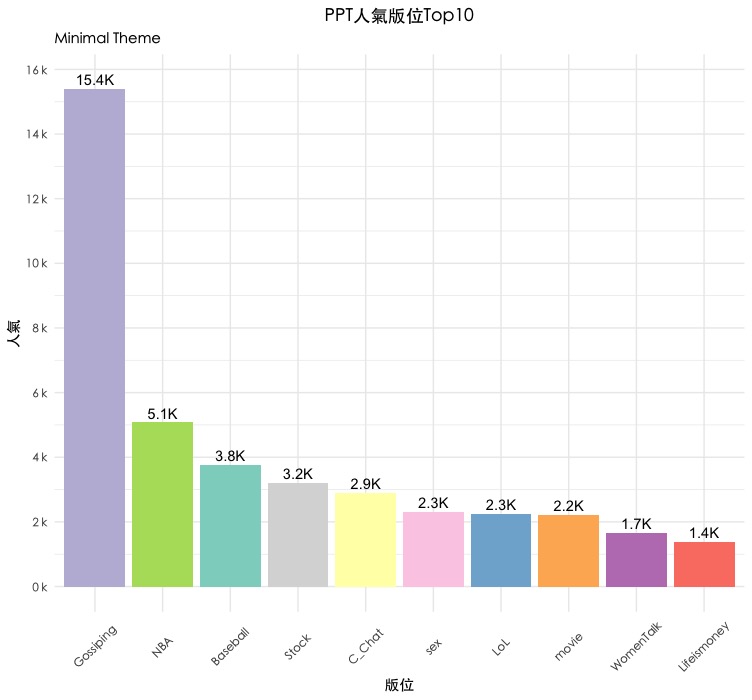
library(stringr) #欲使用str_c()函數: Join multiple strings into a single string. gg a + geom_bar(stat = "identity",aes(fill = boardname)) + geom_text(aes(label = str_c(round(popularity/1000,1),'K'), y = popularity + 300)) + scale_fill_brewer(palette = 'Set3') + labs(title = 'PPT人氣版位Top10', x = "版位", y = "人氣") + theme(text=element_text(family="黑體-繁 中黑"), # 解決中文亂碼問題 axis.text.x = element_text(angle = 45, vjust = 0.5), plot.title = element_text(hjust = 0.5)) + # 將title置中 scale_y_continuous(labels = scales::unit_format("k", 1e-3), #以每千單位顯示 breaks = seq(0,20000, by=2000) #每兩千為間隔 ) gg |
如果想要近一步調整整體圖形風格,可使用theme_xxx()圖層。
- 我們使用比較常用的幾種風格,包括:theme_bw(), theme_classic(), theme_dark(), theme_minimal(), theme_grey(), theme_linedraw()。
- 為了比較不同theme的效果,我們使用ggpubr套件中的ggarnage()函數來排版六張圖表。(只適用ggplot2的物件)
|
1 2 3 4 5 6 7 8 9 10 11 12 13 14 15 16 17 18 19 20 21 22 23 24 25 26 27 28 29 30 31 32 33 34 35 36 37 38 39 40 41 42 43 44 45 46 47 48 49 50 51 52 53 54 55 56 57 58 59 60 61 62 63 |
theme1 gg + theme_bw() + labs(subtitle="BW Theme") + theme(text=element_text(family="黑體-繁 中黑"), # 解決中文亂碼問題 axis.text.x = element_text(angle = 45, vjust = 0.5), plot.title = element_text(hjust = 0.5), legend.position="none" # 移除legend圖示 (亦可調整left/right and top/bottom) ) theme2 gg + theme_classic() + labs(subtitle="Classic Theme") + theme(text=element_text(family="黑體-繁 中黑"), # 解決中文亂碼問題 axis.text.x = element_text(angle = 45, vjust = 0.5), plot.title = element_text(hjust = 0.5), legend.position="none" # 移除legend圖示 (亦可調整left/right and top/bottom) ) theme3 gg + theme_dark() + labs(subtitle = "Dark Theme") + theme(text=element_text(family="黑體-繁 中黑"), # 解決中文亂碼問題 axis.text.x = element_text(angle = 45, vjust = 0.5), plot.title = element_text(hjust = 0.5), legend.position="none" # 移除legend圖示 (亦可調整left/right and top/bottom) ) theme4 gg + theme_minimal() + labs(subtitle = "Minimal Theme") + theme(text=element_text(family="黑體-繁 中黑"), # 解決中文亂碼問題 axis.text.x = element_text(angle = 45, vjust = 0.5), plot.title = element_text(hjust = 0.5), legend.position="none" # 移除legend圖示 (亦可調整left/right and top/bottom) ) theme5 gg + theme_grey() + labs(subtitle = "Grey Theme") + theme(text=element_text(family="黑體-繁 中黑"), # 解決中文亂碼問題 axis.text.x = element_text(angle = 45, vjust = 0.5), plot.title = element_text(hjust = 0.5), legend.position="none" # 移除legend圖示 (亦可調整left/right and top/bottom) ) theme6 gg + theme_linedraw() + labs(subtitle = "Linedraw Theme") + theme(text=element_text(family="黑體-繁 中黑"), # 解決中文亂碼問題 axis.text.x = element_text(angle = 45, vjust = 0.5), plot.title = element_text(hjust = 0.5), legend.position="none" # 移除legend圖示 (亦可調整left/right and top/bottom) ) library(ggpubr) ggarrange(theme1, theme2, theme3, theme4, theme5, theme6, ncol = 3, nrow = 2) |
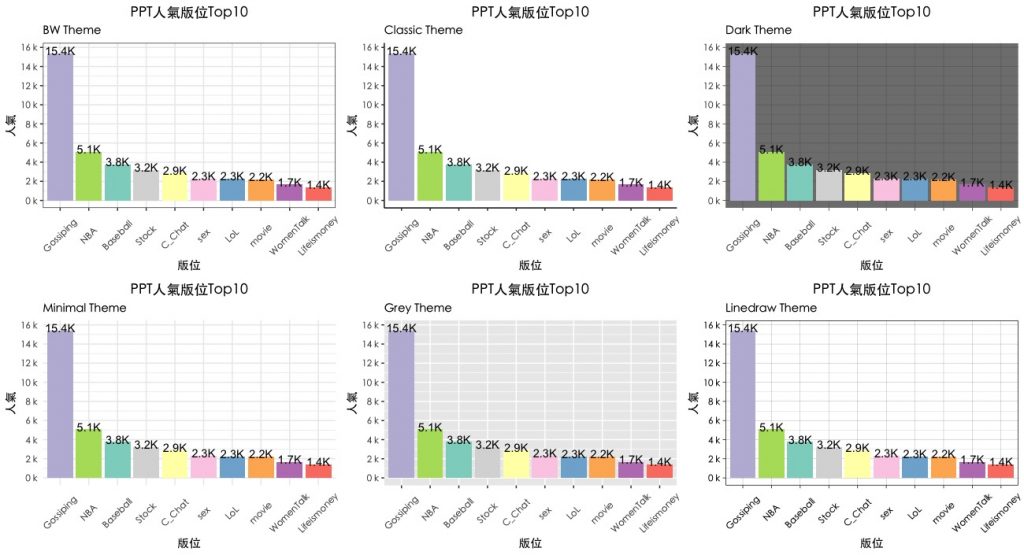
經過上述一系列圖層疊加調整,便完成了我們簡單的bar chart囉!
探索更多統計模型學習筆記:
參考:
