很多時候在比較不同單位的資料走勢時,比如說身高v.s.體重或氣溫v.s.降雨量,會需要雙Y軸(dual y-axis)來繪製,除了有效標記不同資料單位區間大小,並能將兩資料的Y位置等比例壓縮成等高的Y軸區間以利比較。本篇學習筆記將比較ggplot2()與plot()繪製雙y軸(dual y-axis)方法優劣。
dual y-axis plotting 雙Y軸 繪圖
step 1: data preparation
我們直接將台北月平均氣溫與降雨量的查詢結果複製到剪貼簿,並使用read.table(pipe(“pbpaste))的方式讀取。
(*此法為mac系統的剪貼簿,如果為window系統剪貼簿,則改為“clipboard”)
|
1 2 3 |
temp % as.numeric() precipitation % as.numeric() |
接著將月份時間資訊、氣溫與降雨量三個向量合併成data frame。
|
1 2 3 4 5 6 7 8 9 10 11 12 13 14 15 |
df df # date temp precipitation # 1 2010-01-01 16.1 83.2 # 2 2010-02-01 16.5 170.3 # 3 2010-03-01 18.5 180.4 # 4 2010-04-01 21.9 177.8 # 5 2010-05-01 25.2 234.5 # 6 2010-06-01 27.7 325.9 # 7 2010-07-01 29.6 245.1 # 8 2010-08-01 29.2 322.1 # 9 2010-09-01 27.4 360.5 # 10 2010-10-01 24.5 148.9 # 11 2010-11-01 21.5 83.1 # 12 2010-12-01 17.9 73.3 |
摘要氣溫與降雨量敘述統計。
|
1 2 3 4 5 6 7 8 9 |
summary(df[-1]) # temp precipitation # Min. :16.10 Min. : 73.3 # 1st Qu.:18.35 1st Qu.:132.5 # Median :23.20 Median :179.1 # Mean :23.00 Mean :200.4 # 3rd Qu.:27.48 3rd Qu.:264.4 # Max. :29.60 Max. :360.5 |
step 2: plotting using ggplot2()
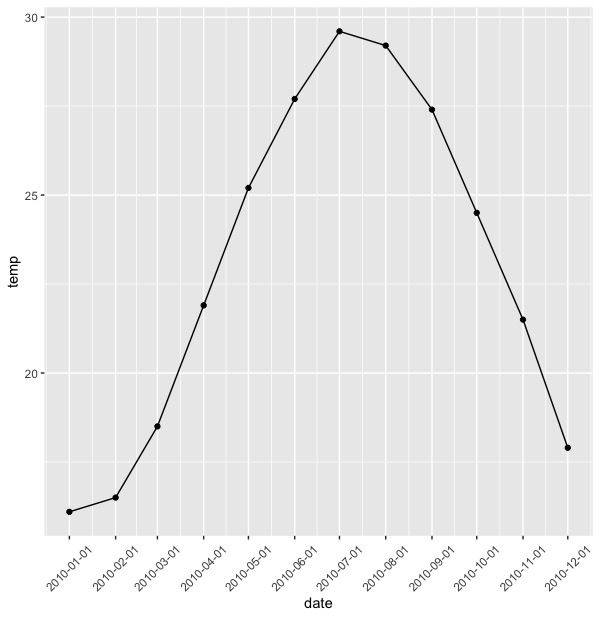
先畫出月份氣溫變化圖。
|
1 2 3 4 5 |
ggplot(data = df) + geom_line(mapping = aes(y = temp, x = date)) + geom_point(mapping = aes(y = temp, x = date)) + scale_x_date(date_breaks = "month") + theme(axis.text.x = element_text(vjust = 0.5, angle = 45)) |
加上第二座標軸。
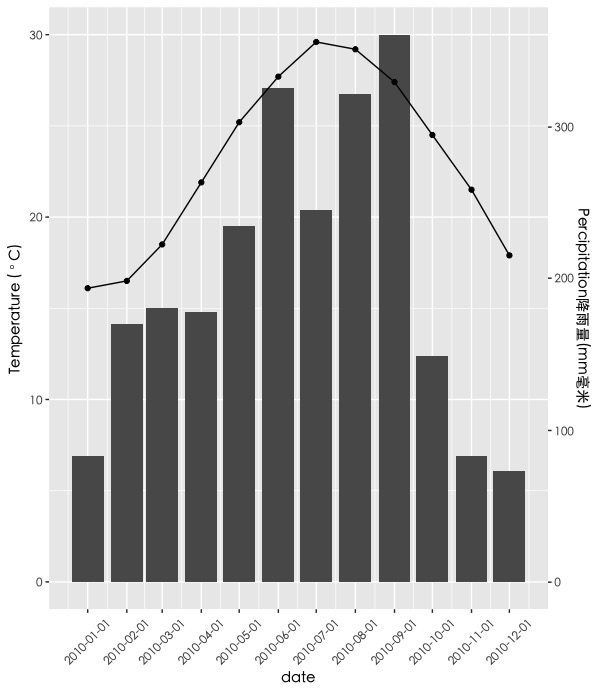
- 使用scale_y_axis(name = …, limits= …)調整主要Y標軸的命名(name)與區間。
- 使用scale_y_axis(sec.axis = sec_axis())加上第二Y軸,調整降雨單位與命名第二Y軸名稱。
|
1 2 3 4 5 6 7 8 9 |
ggplot(data = df) + geom_bar(mapping = aes(y = precipitation * 30/361, x = date), stat = "identity") + geom_line(mapping = aes(y = temp, x = date)) + geom_point(mapping = aes(y = temp, x = date)) + scale_x_date(date_breaks = "month") + scale_y_continuous(name = expression("Temperature ("~degree~"C)"), limits = c(0,30), sec.axis = sec_axis(~. *361/30, name = "Percipitation降雨量(mm毫米)"))+ theme(axis.text.x = element_text(vjust = 0.5, angle = 45), text = element_text(family="黑體-繁 中黑") # 解決中文亂碼問題 ) |
調整色彩與主題外觀。
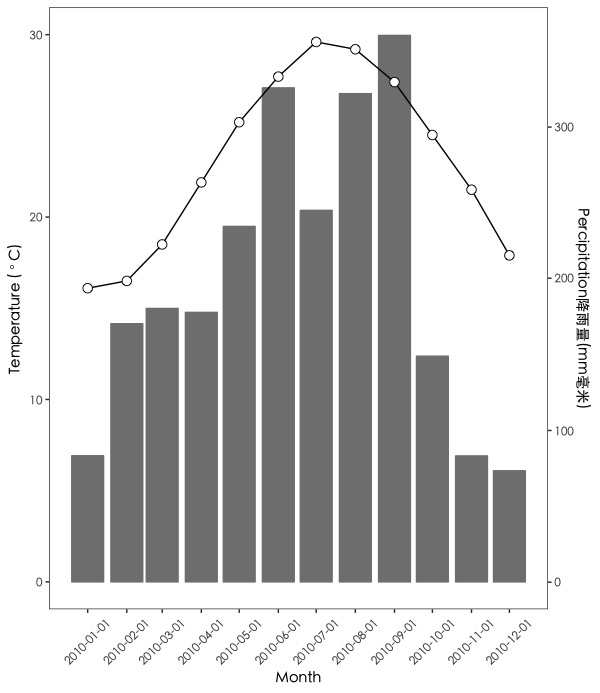
- geom_bar(): 使用colour, fill 來調整長條圖的線條與填充色彩。
- geom_point(): 使用size, shape, fill 來調整點的大小、形狀與填充色彩。
- 使用主題圖層theme_bw()。
- 使用theme()中的panel.grid.major, panel.grid.minor參數將繪圖面板背景的主要次要隔線拿掉。
|
1 2 3 4 5 6 7 8 9 10 11 |
ggplot(data = df) + geom_bar(mapping = aes(y = precipitation * 30/361, x = date), stat = "identity", colour = gray(0.5), fill = gray(0.5)) + # gray() Gray Level Specification geom_line(mapping = aes(y = temp, x = date)) + geom_point(mapping = aes(y = temp, x = date), size = 3, shape = 21, fill = "white") + scale_x_date(name = "Month",date_breaks = "month") + scale_y_continuous(name = expression("Temperature ("~degree~"C)"), limits = c(0,30), sec.axis = sec_axis(~. *361/30, name = "Percipitation降雨量(mm毫米)"))+ theme_bw() + theme(axis.text.x = element_text(vjust = 0.5, angle = 45), text = element_text(family="黑體-繁 中黑"), # 解決中文亂碼問題 panel.grid.major = element_blank(), panel.grid.minor = element_blank() |
調整x軸月份時間標示方式。
- 載入專門處理時間的lubridate套件。我們將使用套件中的month()函數回傳日期的月份並轉換成月份名稱。
|
1 2 3 4 5 6 7 8 9 10 11 12 13 14 |
library(lubridate) ggplot(data = df) + geom_bar(mapping = aes(y = precipitation * 30/361, x = date), stat = "identity", colour = gray(0.5), fill = gray(0.5)) + # gray() Gray Level Specification geom_line(mapping = aes(y = temp, x = date)) + geom_point(mapping = aes(y = temp, x = date), size = 3, shape = 21, fill = "white") + scale_x_date(name = "Month",date_breaks = "month",labels = function(date){return(month(date,label = T,abbr = F))}) + scale_y_continuous(name = expression("Temperature ("~degree~"C)"), limits = c(0,30), sec.axis = sec_axis(~. *361/30, name = "Percipitation降雨量(mm毫米)"))+ theme_bw() + theme(axis.text.x = element_text(vjust = 0.5, angle = 45), text = element_text(family="黑體-繁 中黑"), # 解決中文亂碼問題 panel.grid.major = element_blank(), panel.grid.minor = element_blank() ) |
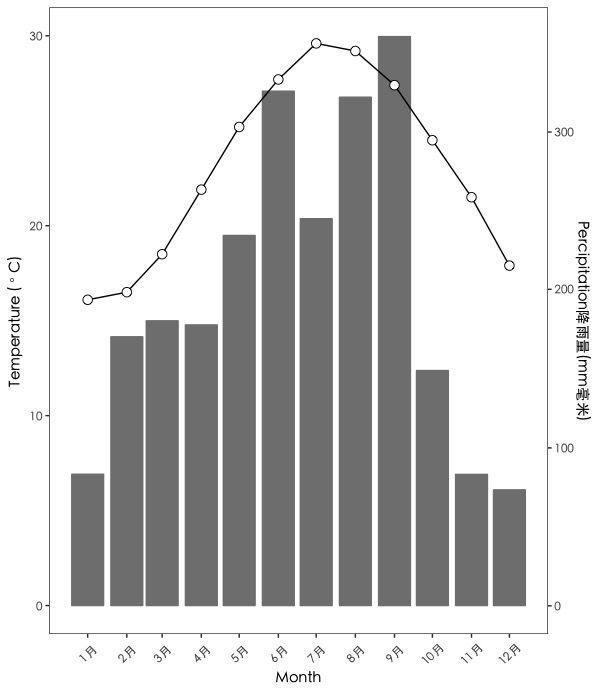
即完成使用ggplot2繪製的雙Y軸(dual y-axis)圖表。
step 3: plotting using plot() & barplot() & axis
我們另外使用非ggplot2套件的方法來處理雙Y軸(dual y-axis)繪圖問題。
首先,我們先畫出每月氣溫變化曲線。
- 使用par(mar = c(bottom, left, top, right)) 來調整繪圖區邊界寬度。
- plot()中,使用type參數來調整
|
1 2 3 4 |
par(mar = c(5,5,3,5)) plot(df$date,df$temp, type = "o", ylab = expression("temperature("~degree~"C)"), main = "台北月平均氣溫與降雨量", xlab = "month", col = "blue", family="黑體-繁 中黑", ylim = c(0,30)) |
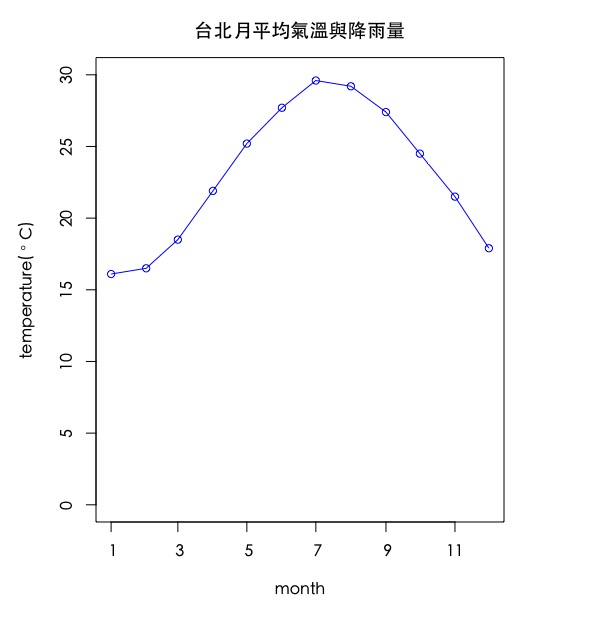
接著,我們就現有圖層上,再加上新圖層barplot(),使用par(new = TRUE)。
- 因為是疊加上去的,為了避免重複的x軸和y軸,我們使用參數xaxt = ‘n’, yaxt = ‘n’將barplot()的x,y軸關閉。
|
1 2 3 4 5 6 |
par(mar = c(5,5,3,5)) plot(df$date,df$temp, type = "o", ylab = expression("temperature("~degree~"C)"), main = "台北月平均氣溫與降雨量", xlab = "month", col = "blue", family="黑體-繁 中黑", ylim = c(0,30)) par(new = TRUE) barplot(df$precipitation,main = "",xaxt = 'n', yaxt = 'n', col = gray(0.8, 0.5),ylim = c(0,370)) |
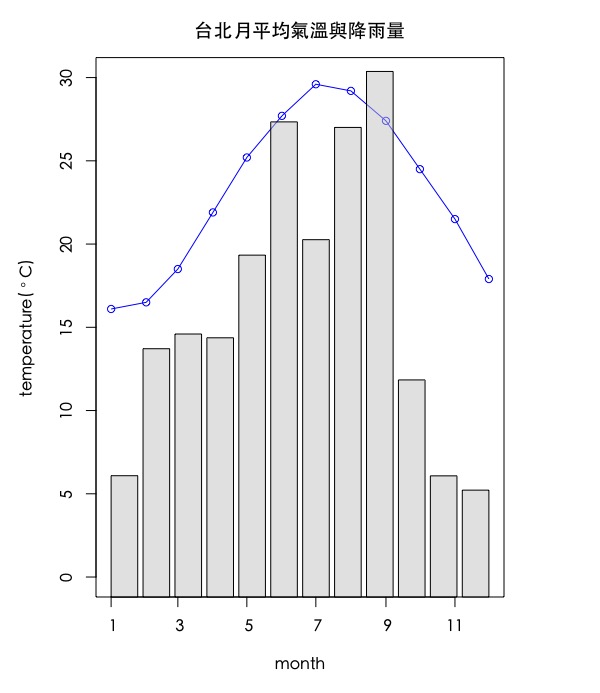
加上右邊y軸的資訊。
- 我們使用axis(side = …)來指定座標軸位置。1=below, 2=left, 3=above and 4=right。
|
1 2 3 4 5 6 7 |
par(mar = c(5,5,3,5)) plot(df$date,df$temp, type = "o", ylab = expression("temperature("~degree~"C)"), main = "台北月平均氣溫與降雨量", xlab = "month", col = "blue", family="黑體-繁 中黑", ylim = c(0,30)) par(new = TRUE) barplot(df$precipitation,main = "",xaxt = 'n', yaxt = 'n', col = gray(0.8, 0.5),ylim = c(0,370)) axis(side = 4) |
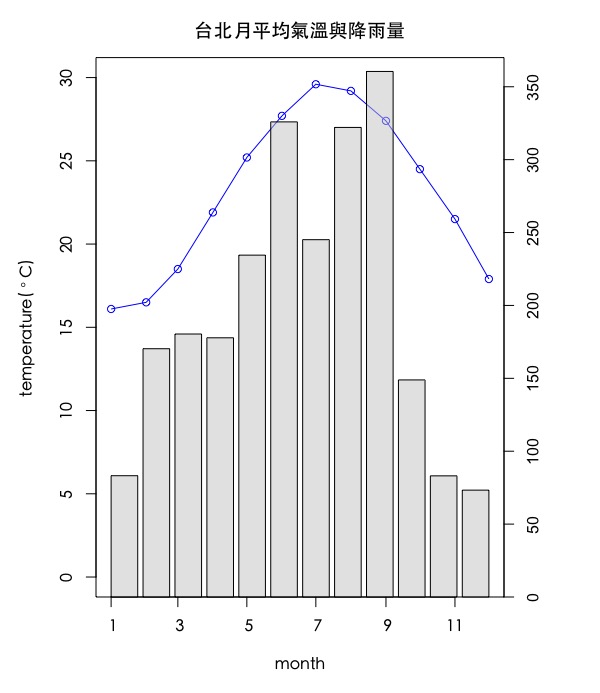
接著使用mtext()標上右邊座標軸的名稱。
|
1 2 3 4 5 6 7 8 |
par(mar = c(5,5,3,5)) plot(df$date,df$temp, type = "o", ylab = expression("temperature("~degree~"C)"), main = "台北月平均氣溫與降雨量", xlab = "month", col = "blue", family="黑體-繁 中黑", ylim = c(0,30)) par(new = TRUE) barplot(df$precipitation,main = "",xaxt = 'n', yaxt = 'n', col = gray(0.8, 0.5),ylim = c(0,370)) axis(side = 4) mtext("percipitation(mm)", side = 4, line = 3) |
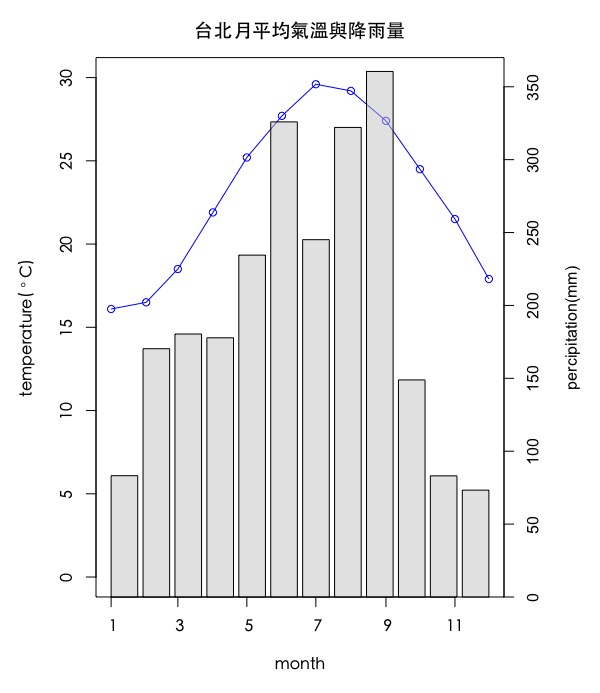
最後加上曲線跟長條圖的圖示說明方框於左上角。
|
1 2 3 4 5 6 7 8 9 |
par(mar = c(5,5,3,5)) plot(df$date,df$temp, type = "o", ylab = expression("temperature("~degree~"C)"), main = "台北月平均氣溫與降雨量", xlab = "month", col = "blue", family="黑體-繁 中黑", ylim = c(0,30)) par(new = TRUE) barplot(df$precipitation,main = "",xaxt = 'n', yaxt = 'n', col = gray(0.8, 0.5),ylim = c(0,370)) axis(side = 4) mtext("percipitation(mm)", side = 4, line = 3) legend("topleft", c("temp", "percipitation"), pch=c(1,15), lty = c(1, 0), col=c("blue","gray"), pt.cex = 1.5) |
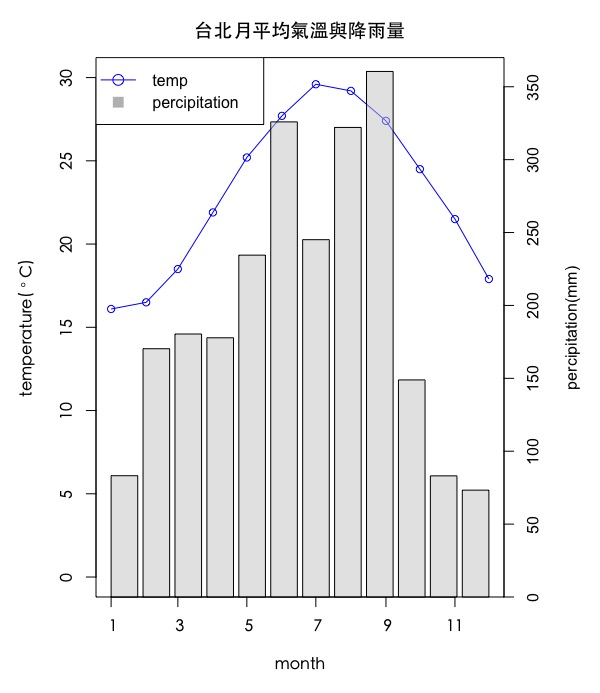
即完成。這邊的好處是,左右兩側Y軸不需特別調整單位縮放問題,即可壓縮在標準化後的等長區間。但缺點是,曲線和長條圖在X軸上沒能對齊。
step 4 : using beaver1 & beaver2 data plotting double lines with dual y-axis
我們試用另外一組資料(海狸體溫資料: beaver1, beaver2)示範,如何使用plot() + axis()來繪製雙Y軸的兩條曲線。(因為都是曲線,就沒有對齊問題,適用於比較曲線圖)
載入海狸1和海狸2的體溫資料
|
1 2 3 4 5 6 7 8 9 10 11 12 13 14 15 16 17 18 19 20 21 22 |
head(beaver1) # day time temp activ # 1 346 840 36.33 0 # 2 346 850 36.34 0 # 3 346 900 36.35 0 # 4 346 910 36.42 0 # 5 346 920 36.55 0 # 6 346 930 36.69 0 head(beaver2) # day time temp activ # 1 307 930 36.58 0 # 2 307 940 36.73 0 # 3 307 950 36.93 0 # 4 307 1000 37.15 0 # 5 307 1010 37.23 0 # 6 307 1020 37.24 0 dim(beaver1) # [1] 114 4 dim(beaver2) # [1] 100 4 |
先畫出第一隻海狸的體溫。
|
1 |
plot(beaver1[1:100,3], type = "l", ylab = "beaver1 temperature") |
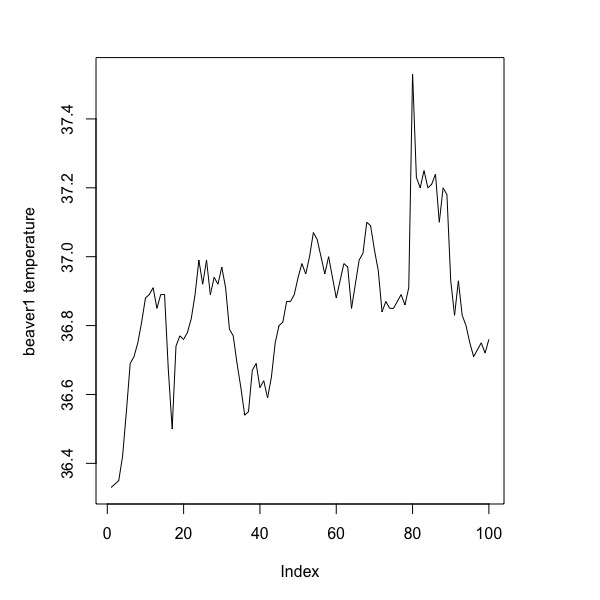
再畫出第二隻海狸的體溫。因為是要加在前一張圖層,故我們使用par(new = TRUE)。
|
1 2 3 |
plot(beaver1[1:100,3], type = "l", ylab = "beaver1 temperature") par(new = TRUE) plot(beaver2[,3], type = "l", xaxt = 'n', yaxt='n', ylab = '', xlab = '') |
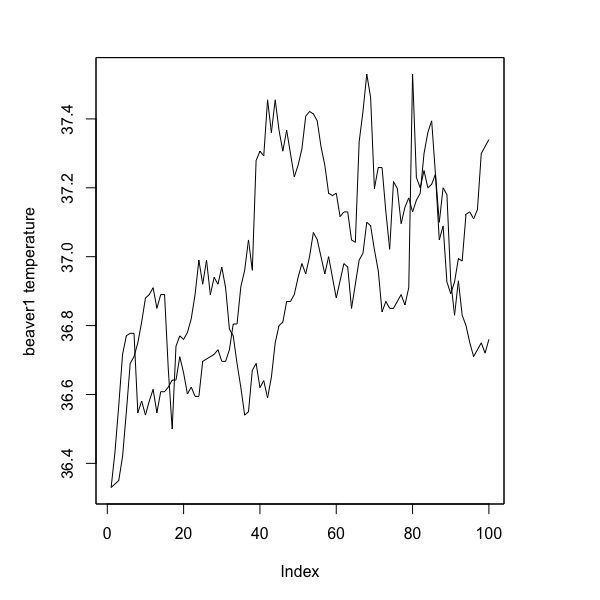
我們來新增第二個y軸並加上新y軸名稱,並條整兩條數列外觀與整體圖表主題。
|
1 2 3 4 5 6 7 8 9 10 11 |
par(mar = c(5,5,3,5)) plot(beaver1[1:100,3], type = "l", ylab = "beaver1 temperature", main = "Beaver temperature plot", xlab = "time", col = "blue") par(new = TRUE) plot(beaver2[,3], type = "l", xaxt = 'n', yaxt='n', ylab = '', xlab = '', lty = 2, col = "red") axis(side = 4) mtext("beaver2 temperature", side = 4, line = 3) legend("topleft", c("beaver1", "beaver2"), col = c("blue", "red"), lty = c(1, 2)) |
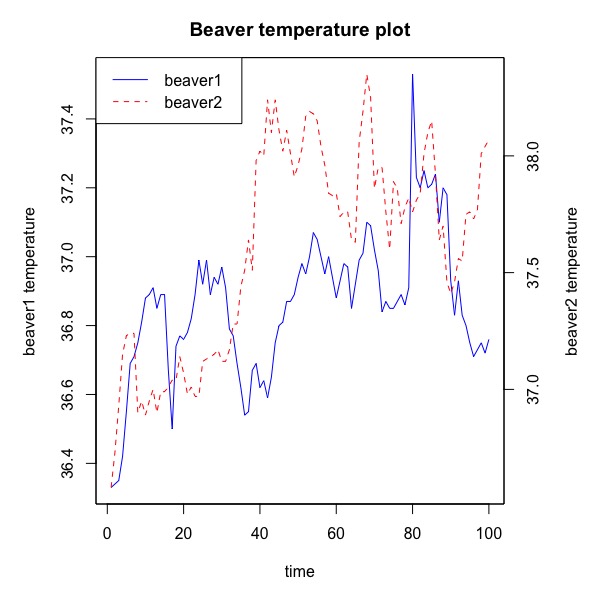
為了確認兩條曲線上每一點是否對齊,我們可以調整曲線樣式(並同時調整圖例說明)。
|
1 2 3 4 5 6 7 8 9 10 |
par(mar = c(5,5,3,5)) plot(beaver1[1:100,3], type = "o", ylab = "beaver1 temperature", main = "Beaver temperature plot", xlab = "time", col = "blue") par(new = TRUE) plot(beaver2[,3], type = "o", xaxt = 'n', yaxt='n', ylab = '', xlab = '', lty = 2, col = "red") axis(side = 4) mtext("beaver2 temperature", side = 4, line = 3) col = c("blue", "red"), lty = c(1, 2)) |
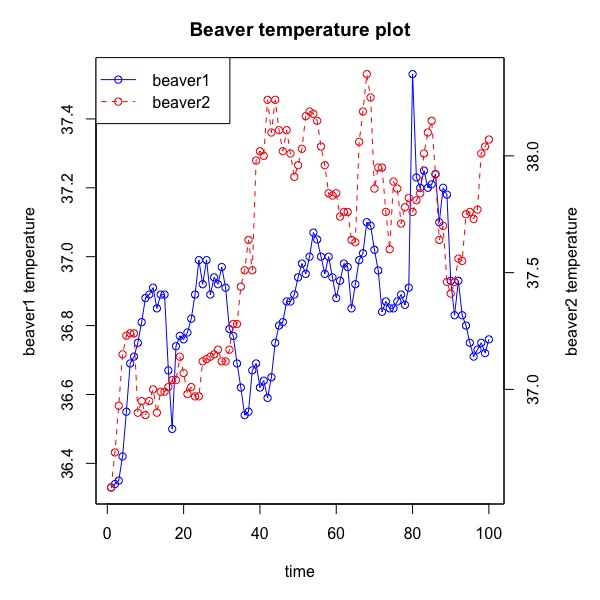
由上圖可發現,當兩筆資料都為曲線資料,即可在x軸對齊的基礎下使用雙Y軸比較走勢。
更多資料視覺化學習筆記:
ggplot2 | 簡易資料視覺化 Basic Data Visualization – part1 | using R SQLite
Summarize Categorical Variables | 類別變數摘要 | 統計 R語言
參考連結:


