本篇整理了使用R語言進行 資料處理(Data Processing) 的 Top 10 FAQ,為了節省健忘的自己反覆google stackoverflow的時間,想要把常見的 資料處理 語法筆記下來。包括資料欄位重新命名、產生隨機亂數、產生data frame、數值區隔化(binning)、資料萃取等。
資料處理 Data Processing 實用的10個小技巧
1. 產生均一分佈(uniform distribution)和常態分佈(normal distribution)的隨機數值(n=100)
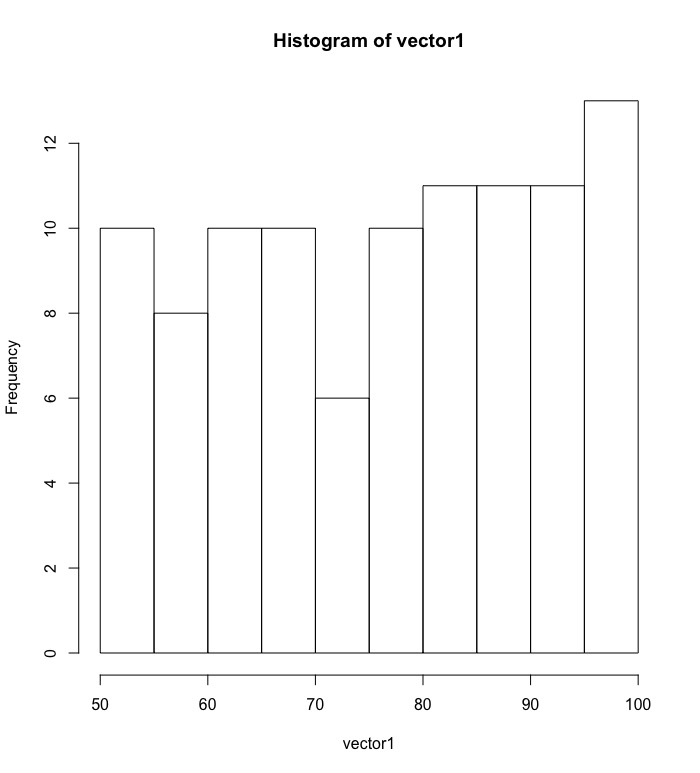
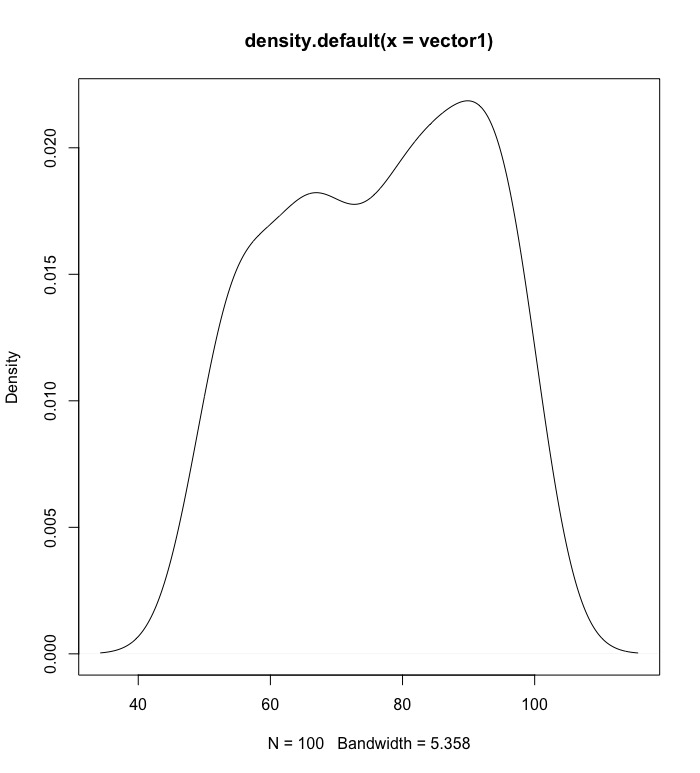
產生100個均一分佈(uniform distribution)的隨機數值向量(並使用種子參數,固定隨機結果)
|
1 2 3 4 5 6 7 8 9 10 |
set.seed(125) (vector1 # [1] 91.23372 55.84255 64.98903 67.82804 98.25975 98.37803 76.65462 66.60778 82.69219 80.72748 50.70648 88.16897 67.96526 55.06754 # [15] 77.83986 71.21092 70.96414 96.67055 83.60329 87.93464 68.69401 86.41751 84.19229 64.76608 78.88808 53.22125 88.13211 56.14755 # [29] 58.42466 50.32025 87.44001 52.76610 97.55393 73.19850 94.65054 80.09208 52.96008 54.36781 94.07018 71.41990 85.78686 64.34257 # [43] 93.64899 63.62392 55.36854 78.86193 87.65080 77.84359 65.02133 75.92287 82.07423 84.34672 51.64452 73.84293 85.64133 67.92616 # [57] 90.67720 50.76088 82.69066 69.70544 76.52618 91.38894 99.59023 80.40770 59.27992 55.20893 88.90397 95.32379 97.02632 68.20486 # [71] 93.56424 96.10821 70.03725 96.28664 56.70781 86.41269 94.10011 60.09537 52.10116 75.80777 78.15360 98.07568 62.58464 76.18880 # [85] 91.73484 91.92365 53.81340 97.19763 88.37050 92.86988 67.39574 80.36109 60.43717 83.97030 65.76207 64.23523 96.80940 95.01764 # [99] 62.68376 60.57814 |
檢視此分佈次數長條圖
|
1 |
hist(vector1) |
檢視此分佈的密度機率圖
|
1 |
plot(density(vector1)) |
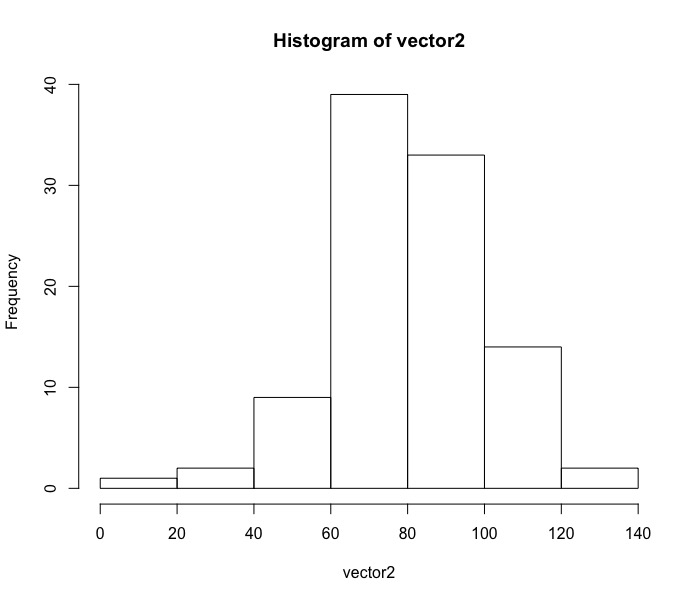
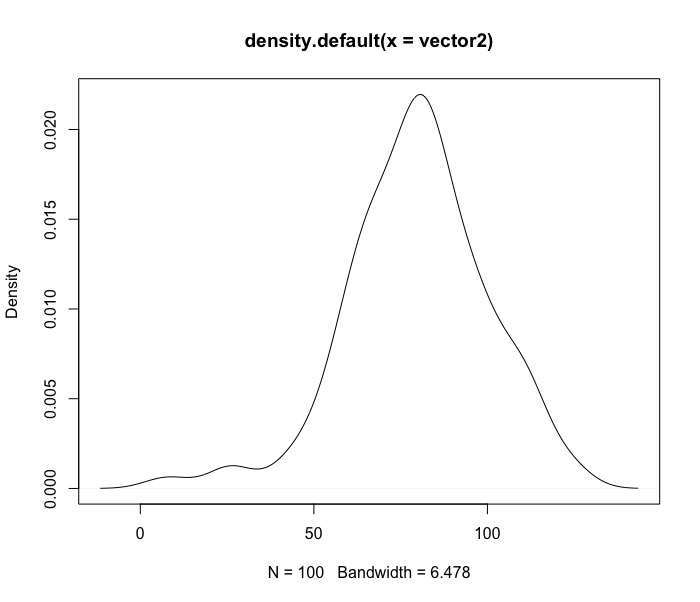
產生100個常態分佈(normal distribution)的隨機數值向量(並使用種子參數,固定隨機結果)。預設的常態平均值為0,標準差為1,我們將之改之為平均數80,標準差20。
|
1 2 3 4 5 6 7 8 9 10 11 12 13 |
# default的平均數為0標準差為1 set.seed(125) (vector2 # [1] 94.570870 98.860533 87.227846 101.200558 94.796854 7.888396 97.381079 53.707525 79.820673 65.226583 83.604616 # [12] 56.674802 71.379024 65.341515 87.235630 58.500588 75.307624 108.529317 67.545379 88.757267 91.186797 80.637498 # [23] 58.256334 67.982055 55.808330 77.750359 112.401569 73.330030 73.434837 100.468880 80.106676 76.615631 84.601009 # [34] 92.579101 88.146062 107.731379 113.084699 83.316553 110.208551 81.149520 79.759604 49.380636 112.434828 87.833169 # [45] 91.378179 97.054735 122.659543 61.942937 25.111649 82.308347 79.105285 109.440641 79.853266 75.837099 82.781623 # [56] 42.761641 102.445376 69.369917 101.587147 66.119959 60.815382 88.419203 86.486531 68.378261 95.710587 91.941595 # [67] 78.080758 61.061284 79.886693 77.463590 82.142727 68.684041 44.079131 113.286471 65.865280 78.415170 79.630492 # [78] 53.089088 82.405446 83.816031 70.476195 123.994033 64.910649 75.873647 88.055012 102.208292 78.195002 74.755952 # [89] 63.820298 83.646523 96.931187 84.085811 27.184622 68.838557 66.301864 61.246448 60.270783 68.055789 109.457474 # [100] 94.410342 |
檢視此分佈次數長條圖
|
1 |
hist(vector2) |
檢視此分佈的密度機率圖
|
1 |
plot(density(vector2)) |
2. concatenate strings 串連字串 using paste() / paste0()
使用paste(),paste0()函數,會先將物件轉換成字元型態(as.character)再合併成新字串。
paste()跟paste0()最大差異就是參數差異如下:
- (1) paste()有sep參數: 可以調整合併時的字串間的間隔,預設為空白。
- (2) paste0()有collapse參數: 可將所有合併後的新字串合併成一個字串。
我們因為沒有要將100列的新字串合併成單一新字串,因此單純使用paste()即可。
我們這裡示範將數值串連百分比%符號合成新字串。因為sep預設為空白格,我們將空白拿掉。
|
1 2 3 4 5 6 7 8 9 10 |
(vector3 # [1] "0.46%" "-1.46%" "0.58%" "-1.28%" "0.35%" "1.06%" "1.65%" "0.81%" "0.49%" "2.48%" "-0.43%" "-0.26%" "1.57%" "1.03%" # [15] "0.4%" "0.01%" "-0.7%" "-0.16%" "1.43%" "-1.67%" "0.75%" "0.49%" "-0.24%" "1.14%" "-0.56%" "-0.12%" "1.08%" "-0.51%" # [29] "-0.01%" "-0.06%" "-0.43%" "-1.52%" "0.26%" "1.46%" "1.09%" "0.39%" "-0.85%" "0.08%" "-0.94%" "0.06%" "0.79%" "-0.44%" # [43] "-0.75%" "-1.04%" "1.44%" "-1.28%" "-1.39%" "0.1%" "-0.92%" "1.75%" "0.61%" "0.82%" "-0.8%" "-1.13%" "0.54%" "-1.07%" # [57] "-0.91%" "1%" "-0.15%" "-2.07%" "0.56%" "2.27%" "-2.53%" "-0.38%" "0.86%" "0.58%" "-0.58%" "-1.85%" "-0.64%" "-1.24%" # [71] "-2.18%" "-0.85%" "-1.2%" "0.05%" "-1.11%" "-2.7%" "0.36%" "-0.77%" "0.56%" "-0.37%" "0.11%" "0.76%" "-0.45%" "-1.3%" # [85] "1.8%" "-0.18%" "1.17%" "-1.01%" "0.22%" "-0.17%" "-0.67%" "0.68%" "1.38%" "0.67%" "-2.06%" "0.62%" "1.17%" "0.48%" # [99] "-1.77%" "-2.4%" |
3. 產生時間序列
可以使用seq.Date()函數,只要設定區間起始日期(from= …, to=…),和間隔(by = "day", "week", "month", "quarter" or "year"),即可自動產生時間序列。
|
1 2 3 4 5 6 7 8 9 10 11 12 13 14 |
(vector4 # [1] "2018-08-01" "2018-08-02" "2018-08-03" "2018-08-04" "2018-08-05" "2018-08-06" "2018-08-07" "2018-08-08" "2018-08-09" # [10] "2018-08-10" "2018-08-11" "2018-08-12" "2018-08-13" "2018-08-14" "2018-08-15" "2018-08-16" "2018-08-17" "2018-08-18" # [19] "2018-08-19" "2018-08-20" "2018-08-21" "2018-08-22" "2018-08-23" "2018-08-24" "2018-08-25" "2018-08-26" "2018-08-27" # [28] "2018-08-28" "2018-08-29" "2018-08-30" "2018-08-31" "2018-09-01" "2018-09-02" "2018-09-03" "2018-09-04" "2018-09-05" # [37] "2018-09-06" "2018-09-07" "2018-09-08" "2018-09-09" "2018-09-10" "2018-09-11" "2018-09-12" "2018-09-13" "2018-09-14" # [46] "2018-09-15" "2018-09-16" "2018-09-17" "2018-09-18" "2018-09-19" "2018-09-20" "2018-09-21" "2018-09-22" "2018-09-23" # [55] "2018-09-24" "2018-09-25" "2018-09-26" "2018-09-27" "2018-09-28" "2018-09-29" "2018-09-30" "2018-10-01" "2018-10-02" # [64] "2018-10-03" "2018-10-04" "2018-10-05" "2018-10-06" "2018-10-07" "2018-10-08" "2018-10-09" "2018-10-10" "2018-10-11" # [73] "2018-10-12" "2018-10-13" "2018-10-14" "2018-10-15" "2018-10-16" "2018-10-17" "2018-10-18" "2018-10-19" "2018-10-20" # [82] "2018-10-21" "2018-10-22" "2018-10-23" "2018-10-24" "2018-10-25" "2018-10-26" "2018-10-27" "2018-10-28" "2018-10-29" # [91] "2018-10-30" "2018-10-31" "2018-11-01" "2018-11-02" "2018-11-03" "2018-11-04" "2018-11-05" "2018-11-06" "2018-11-07" # [100] "2018-11-08" |
4. 產生data frame
這邊示範如何自行建置一個二維的data frame,欄位名稱為”=”符號左側之名稱。data frame各組成向量可以是不同的資料型態,只要注意向量長度需相同則行。
|
1 2 3 4 5 6 7 8 9 10 11 12 13 14 15 16 17 18 |
df head(df) # 維度一 維度二 # 1 1 a # 2 2 b # 3 3 c # 4 4 d # 5 5 e # 6 6 f tail(df) # 維度一 維度二 # 95 95 a # 96 96 a # 97 97 a # 98 98 a # 99 99 a # 100 100 a |
5. 將不同向量vector 與data frame合併成新的data frame
使用的是cbind()函數(column bind)。而cbind.data.frame()函數則是事前先把物件都轉換成data frame型態 (as.data.frame())。進行cbind時僅需確保資料長度是相同的。
|
1 2 3 4 5 6 7 8 9 10 11 12 13 14 15 16 17 18 19 |
df.new head(df.new) # 維度一 維度二 vector1 vector2 vector3 vector4 # 1 1 a 91.23372 94.570870 0.46% 2018-08-01 # 2 2 b 55.84255 98.860533 -1.46% 2018-08-02 # 3 3 c 64.98903 87.227846 0.58% 2018-08-03 # 4 4 d 67.82804 101.200558 -1.28% 2018-08-04 # 5 5 e 98.25975 94.796854 0.35% 2018-08-05 # 6 6 f 98.37803 7.888396 1.06% 2018-08-06 class(df.new) # [1] "data.frame" str(df.new) # 'data.frame': 100 obs. of 6 variables: # $ 維度一 : int 1 2 3 4 5 6 7 8 9 10 ... # $ 維度二 : Factor w/ 52 levels "a","A","b","B",..: 1 3 5 7 9 11 13 15 17 19 ... # $ vector1: num 91.2 55.8 65 67.8 98.3 ... # $ vector2: num 94.6 98.9 87.2 101.2 94.8 ... # $ vector3: Factor w/ 93 levels "-0.01%","-0.06%",..: 61 38 66 35 57 78 88 74 63 93 ... # $ vector4: Date, format: "2018-08-01" "2018-08-02" "2018-08-03" "2018-08-04" ... |
(*若是要將資料列合併,則使用rbind(),此時要注意的就是資料維度要一樣。)
6. 重新命名資料欄位名稱
如果遇到欄位名稱太長或是為中文時,會想要重新命名。
全部都重新命名。
|
1 2 3 4 5 6 7 8 9 |
names(df.new) head(df.new) # order letters random.uniform random.normal percentage date # 1 1 a 91.23372 94.570870 0.46% 2018-08-01 # 2 2 b 55.84255 98.860533 -1.46% 2018-08-02 # 3 3 c 64.98903 87.227846 0.58% 2018-08-03 # 4 4 d 67.82804 101.200558 -1.28% 2018-08-04 # 5 5 e 98.25975 94.796854 0.35% 2018-08-05 # 6 6 f 98.37803 7.888396 1.06% 2018-08-06 |
只取部分欄位進行重新命名。
|
1 2 3 4 5 6 7 8 9 10 |
names(df.new)[colnames(df.new)=='order'] head(df.new) # row.order letters random.uniform random.normal percentage date # 1 1 a 91.23372 94.570870 0.46% 2018-08-01 # 2 2 b 55.84255 98.860533 -1.46% 2018-08-02 # 3 3 c 64.98903 87.227846 0.58% 2018-08-03 # 4 4 d 67.82804 101.200558 -1.28% 2018-08-04 # 5 5 e 98.25975 94.796854 0.35% 2018-08-05 # 6 6 f 98.37803 7.888396 1.06% 2018-08-06 |
7. 根據資料pattern萃取所需資訊 : using sub()
假設想要萃取percentage欄位的數值資訊,並將資料型態改為數值型。我們使用sub()和as.numeric()。
(*更多Pattern Matching and Replacement函數用法介紹)
|
1 2 3 4 5 6 7 8 9 10 |
df.new$percentage head(df.new) # row.order random.uniform random.normal percentage date # 1 1 91.23372 94.570870 0.0046 2018-08-01 # 2 2 55.84255 98.860533 -0.0146 2018-08-02 # 3 3 64.98903 87.227846 0.0058 2018-08-03 # 4 4 67.82804 101.200558 -0.0128 2018-08-04 # 5 5 98.25975 94.796854 0.0035 2018-08-05 # 6 6 98.37803 7.888396 0.0106 2018-08-06 |
8. 連續變數區間化(bin, segmentation) : using cut()。
比如說年齡資訊,在進行統計分析時,都會將數值組成新的區間以利摘要。
最長使用的函數為cut()系列,包括cut_interval(), cut_number(), cut_width()。
- cut_interval():會確保每一個間隔區間(range)是等分的。
- cut_number() : 會確保每一組內觀測值數目(幾乎)是相同的。
- cut_width() : 會確保每一組的寬度(width)相同,並且能調整長條圖的邊界(boundary)和中心點(center)。
|
1 2 3 4 5 6 |
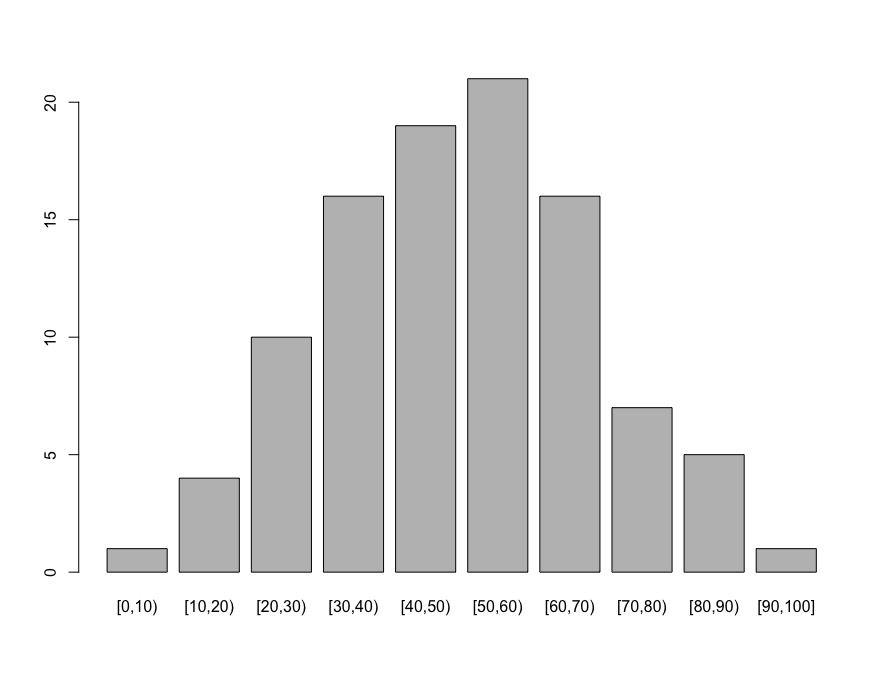
set.seed(423) df.new$age df.new$seg.age table(df.new$seg.age) # [0,10) [10,20) [20,30) [30,40) [40,50) [50,60) [60,70) [70,80) [80,90) [90,100] # 1 4 10 16 19 21 16 7 5 1 |
將年齡區間分佈以長條圖畫出。
|
1 |
plot(df.new$seg.age) |
9. 刪除不感興趣的資料欄位
有時在分析時,我們會捨棄一些對分析沒幫著的維度。
我們先隨機產生一個不需要的欄位稱作”nouse”
|
1 2 3 4 5 6 7 8 9 10 |
set.seed(423) df.new$nouse head(df.new) # row.order letters random.uniform random.normal percentage date age seg.age nouse # 1 1 a 91.23372 94.570870 0.46% 2018-08-01 25.35967 [20,30) 33.03950 # 2 2 b 55.84255 98.860533 -1.46% 2018-08-02 88.41891 [80,90) 127.62837 # 3 3 c 64.98903 87.227846 0.58% 2018-08-03 35.08060 [30,40) 47.62090 # 4 4 d 67.82804 101.200558 -1.28% 2018-08-04 60.08320 [60,70) 85.12480 # 5 5 e 98.25975 94.796854 0.35% 2018-08-05 24.58924 [20,30) 31.88386 # 6 6 f 98.37803 7.888396 1.06% 2018-08-06 33.34497 [30,40) 45.01745 |
再使用下列指令將該欄位捨棄。
|
1 2 3 4 5 6 7 8 9 10 |
df.new head(df.new) # row.order letters random.uniform random.normal percentage date age seg.age # 1 1 a 91.23372 94.570870 0.46% 2018-08-01 25.35967 [20,30) # 2 2 b 55.84255 98.860533 -1.46% 2018-08-02 88.41891 [80,90) # 3 3 c 64.98903 87.227846 0.58% 2018-08-03 35.08060 [30,40) # 4 4 d 67.82804 101.200558 -1.28% 2018-08-04 60.08320 [60,70) # 5 5 e 98.25975 94.796854 0.35% 2018-08-05 24.58924 [20,30) # 6 6 f 98.37803 7.888396 1.06% 2018-08-06 33.34497 [30,40) |
10. 根據分析目的更換資料欄位順序
法1: 使用欄位指標column index來重新排列欄位
|
1 2 3 4 5 6 7 8 9 |
df.final head(df.final) # row.order date letters random.uniform random.normal percentage age seg.age # 1 1 2018-08-01 a 91.23372 94.570870 0.46% 25.35967 [20,30) # 2 2 2018-08-02 b 55.84255 98.860533 -1.46% 88.41891 [80,90) # 3 3 2018-08-03 c 64.98903 87.227846 0.58% 35.08060 [30,40) # 4 4 2018-08-04 d 67.82804 101.200558 -1.28% 60.08320 [60,70) # 5 5 2018-08-05 e 98.25975 94.796854 0.35% 24.58924 [20,30) # 6 6 2018-08-06 f 98.37803 7.888396 1.06% 33.34497 [30,40) |
法2: 使用欄位名稱column name來重新排列欄位
|
1 2 3 4 5 6 7 8 9 |
df.final head(df.final) # row.order date letters random.uniform random.normal percentage seg.age age # 1 1 2018-08-01 a 91.23372 94.570870 0.46% [20,30) 25.35967 # 2 2 2018-08-02 b 55.84255 98.860533 -1.46% [80,90) 88.41891 # 3 3 2018-08-03 c 64.98903 87.227846 0.58% [30,40) 35.08060 # 4 4 2018-08-04 d 67.82804 101.200558 -1.28% [60,70) 60.08320 # 5 5 2018-08-05 e 98.25975 94.796854 0.35% [20,30) 24.58924 # 6 6 2018-08-06 f 98.37803 7.888396 1.06% [30,40) 33.34497 |
更多資料處理相關學習筆記:


